My interest in the rose program was aroused many years ago when I first read the 1987 article A rose is a rose by Peter Maurer. This interesting paper discusses the rose program and gives two alternative algorithms for producing the rose figures. Although there are similarities between the rose configurations and the spirograph figures, the underlying equations are quite different, and we shall extract some quite different mathematics here.
The basic rose figures were known long before 1987. These simple flower patterns go back to before 1730 when the curves were named rhodonea by the Italian mathematician Guido Grandi because they resemble a rose. Some simple examples are given below.
To understand the rose configuration, we need polar coordinates.
Polar coordinates In the Cartesian plane we choose two perpendicular axes, the x-axis and the y-axis meeting at the origin O. With respect to these axes, we can designate the position of any point P in the plane by a pair of coordinates (x, y). However, these are not the only possible coordinates for defining the position of P. In the triangle at right, we see that the position of P is also determined by its distance r from the origin, and the angle (theta) the line OP makes with the x-axis. We thus obtain the polar coordinates (r, ) of the point P. We make three observations.
• The number r is a non-negative distance. However, we shall return to this shortly.
• The origin O corresponds to r = 0, and any angle. Thus there is no unique representation of O.
• To make the coordinate representation unique for P O, we choose the angle to lie within some range of 2, for example, 0 < 2 (or equivalently, 0° < 360°.
There are fairly simple relations between r, and x, y. Thus r = (x2 + y2), and = arctan (y/x).
• Just for practice, find the polar coordinates for the Cartesian points (2, 0), (0, 3), (0, –4), (1, 1), (–1, 3).
In polar coordinates, (2, 0) is (2, 0)!, (0,3) is (3, /2),
(0, –4) is (4, ), (1, 1) is (2, /4), (–1, 3) is (2, 2/3).
The rose and the applet
The basic equation of the rose is given in polar coordinates by r = sin(n) [sin(lp*theta) in the applet]. The graph of the sine curve between 0 and 2 is given at right, and we notice that the curve takes negative values. For these negative values of sin(n), we interpret r as being measured in the ‘backwards’ direction: that is, for given the r-ray will point in direction – .
• Now check out this rose appletby Bill Beaumont. Resize the window and place it in the top right of your screen. Just play with the controls to see what they do! Now set Delta = 1, and investigate Loops = 1, 2, 3, 4. You should get the circle and the three flower patterns given above.
[Note: The ‘slow‘ button in the applet is intended to allow the viewer to see the actual formation of the cosets. This appears to work on PCs, but not on Macs where there is a pause before the final generated figure appears.]
For example, for r = sin(2) we get the quadrifolium shown right. For increasing from 0 to /4, r increases from 0 to 1 (top right). For increasing from /4 to /2, r decreases from 1 to 0, completing the top right petal. For increasing from /2 to 3/4 to , r changes from 0 to –1 to 0; we are facing top left (according to ), but the r values are negative, so we are constructing the bottom right petal. Continuing, we next construct the bottom left petal, and then the top left petal for which negative values of r again appear.
In actual fact, because computer drawing is always done with a downward y-axis, the above construction is actually a reflection in the x-axis of the above description!
This becomes apparent for the trifolium with polar equation r = sin(3): the figure is upside down to what one would naturally expect. We would also expect six petals here, but because 3 is an odd number, it turns out that each petal is traced over twice.
So the general pattern is:
if n is even, a 2n-petalled flower is generated; if n is odd, an n-petalled flower is generated.
• Use the applet, still with Delta = 1 to investigate the truth of this statement.
• You might also like to try to explain why r = 1 gives a circle.
Notice that the origin is not the centre of this circle; it is a point on the circle.
So what does Delta do?
The rose algorithm is an iterative process: that is it is formed in a sequence of steps, each step building on the previous step. Delta () is a fixed angle (for a given rose) which assists with this building. The algorithm starts with angle 0, i.e. facing out along the x-axis, and plots the origin O. We then turn through angle at the origin and move in a straight line until we first strike the rose curve. This last step is then repeated again and again. The nice petalled flowers we have found so far all have = 1°, leading to smooth curves, but it doesn’t have to be this way.
• How many line segments does a rose have? Use the applet to help you complete the table below. For a given Delta, try various n values [loops] to find one that is easy to count. [On occasion you will find a dot: ignore such values. Also notice that straight segments crossing at O each count for 2.]
# segments
72
5
36
18
10
54
20
63
40
252
...
...
...
...
So, what is the relationship between and the number of segments drawn?
# Our experimenting seems to indicate that if divides 360 exactly, then 360/ is the number of lines produced. This makes sense, because after drawing this number of lines we should be back at our initial position. If does not divide 360 exactly, things get a little more tricky. We might guess (correctly) here that the number of lines is 360/k where k is the greatest common divisor of 360 and . This fits with our first results as the greatest common divisor of 360 and when divides 360 exactly is itself.
Some group structure
Suppose we consider the integers 0, 1, 2, 3, ... , 359. We attach an operation of adding two numbers together, and then taking the non-negative remainder on division by 360. This is called addition modulo 360.
So for example, 80 + 120 = 200, and 200 + 200 [= 400 = 360 + 40] = 40.
This system of integers with this operation is called a group, G. Technically it satisfies the following four rules:
(1) It is closed : using addition modulo 360 on any two members of the set gives a member of the set.
(2) It is associative : for all a, b, c in the set, a + (b + c) = (a + b) + c. This is true for all the integers.
(3) There is a ‘zero’ in the set : 0 for which a + 0 = a = 0 + a.
(4) Every element in the set has an ‘additive inverse’ : for any a there is an element b in the set with a + b = 0 = b + a. Clearly 0 is its own inverse. For any other a simply choose b = 360 – a which is in the set.
A group is a fairly simple structure which has some interesting theory.
One interesting thing we can use here is the idea of a subgroup, H. This is a subset of the original group which is itself a group. An example is:
H = {0, 40, 80, 120, 160, 200, 240, 280, 320}
• Check (briefly) that this set satisfies the above group laws.
Suggest some other sets that will be subgroups of G.
# In fact the multiples of any in the group will form a subgroup of G (perhaps the whole group).
The number of elements in this subgroup is called the order of in G.
Cosets and making pretty displays
• In the rose applet, take some fixed value of n and run through some values of . You will find that some of the designs you achieve are intricate and pleasing. Others are simple and not very attractive at all.
Peter Maurer noticed this and devised an applet that overcomes this ‘deficiency’ – well, it is a deficiency if you are interested in creating beautiful figures!
The figure at right corresponds to the value = 72 and n = 3. It is rather boring as an artistic figure. In group terms, this generates the subgroup H :
H = {0, 72, 144, 216, 288}.
We observe that the whole of the group G = (0, 1, 2, 3, ..., 359} actually breaks into 72 non-overlapping subsets called cosets of H in G. These are
This sequence of cosets stops here. For if we go one step further, noting that 360 is replaced by 0 (modulo 360), we obtain H + 72 = {72, 144, 216, 288, 0} = H, and we are back where we started.
Also, if we thought of H as being generated by 216, rather than by 72, we would get the same cosets. The number of cosets here is given by the greatest common divisor of 360 and 216 : namely 72.
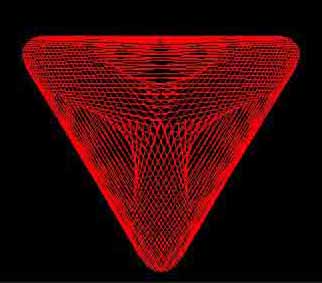
Now Peter Maurer's idea was this. Let us take the curve r = sin(n) – in our case, sin (3). Corresponding to H, the original algorithm now generates the sequence of points ( , sin(3 )) for = 0°, d°, 2d°, ... ; in our case, d = 72. To this original figure we now add to it the 71 further figures corresponding to the remaining 71 cosets. At first sight we might expect to get the original figure plus 71 rotated figures, but it is not as simple as this. For when we replace by +1, the point ( , sin(3 )) is replaced by ( + 1 , sin(3( + 1 )) which may be quite differently placed. In our example, if we think of the original figure having its points on five equally spaced spokes radiating out from the origin, then the points corresponding to a coset will have its points on a rotated set of spokes, but the points themselves will be differently placed on the spokes. Notice that if the sine value is negative, the point will be placed on the reflection of that spoke in the origin. Here are some examples of coset figures. Notice that in the second and third figures, the yellow construction spokes are rotated 24° and 30° respectively from the original figure. Below is the figure made up of the union of all the cosets. Much prettier than the original!
H
H + 24
H + 30
Final thought. We might obtain another set of pretty figures in place of the original unimaginative display by taking the cosets of n rather than of . You might like to explore this idea.
Bibliography
‘A rose is a rose’, Peter M. Maurer, American Mathematical Monthly 94, 631 – 645 (1987).
 Polar coordinates
 The rose and the applet
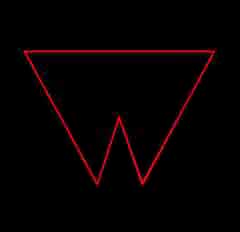 The figure at right corresponds to the value